Likes feel good. Comments are useful. Shares can help a video spread. And everyone wants more views....
But if your goal is getting more awareness from social media video, there is one metric I keep coming back to:
Audience retention.
Retention shows whether people actually stayed to watch your video, where you lost them, and what you should change the next time you edit.

I'm Matt Sullivan and I've had over 50,000,000 views on my personal content over the years and if there's one thing that leads to socail media success, it's being experimental and reviewing the analytics and insights to make changes.
TL;DR: What You Need to Know About Video Retention
- Video retention measures how much of your audience keeps watching as your video progresses.
- A sharp drop in the first few seconds usually points to a weak hook.
- A big drop later in the video can expose a boring section, weak delivery, or an ending that drags.
- A good hook is not enough. Your video still has to deliver on the promise that made someone stop scrolling.
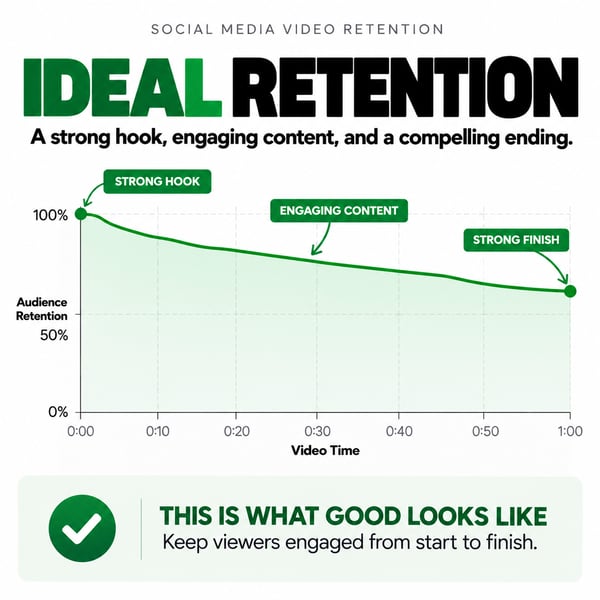
- As a practical reference point, retaining 50% to 60% of viewers through the first few seconds can be a strong start, while holding around 30% deep into a short-form video can indicate strong retention. These are reference points, not universal rules.
- Do not be afraid to cut a weak section, change the hook, and repost a better edit.
- For awareness content, your retention graph is one of the best places to look when you want to understand why a video worked or failed.
What Is Social Media Video Retention?
Social media video retention is the percentage of viewers who continue watching your video as it progresses. A retention graph starts with the people who began watching and shows how many of them are still there at each point in the video.
Imagine 100 people start your video.
If 60 are still watching three seconds later, you have 60% retention at that point. If 30 people are still watching halfway through, you have 30% retention there.
Simple.
The closer your retention line stays to the top of the graph, the more attention you are holding.
And yes, almost every retention graph falls. That is normal. Keeping 100% of viewers until the end is not a realistic expectation for most social media videos.
The important part is how the graph falls, when it falls, and how many people remain.
Why Is Video Retention So Important on Social Media?
Because views do not tell the whole story.
Someone can technically start your video and leave almost immediately. That view might still show up somewhere in your analytics, depending on the platform and metric you are looking at.
But did you actually get their attention?
Retention gets much closer to answering that question.
YouTube describes engagement as whether viewers stick around after they start watching. Its recommendation guidance specifically tells creators to use audience retention to understand where viewers drop off, stay interested, or watch through to completion. TikTok has also publicly said that watch time factors into recommendations and that finishing a longer video is a stronger indication of interest than weaker signals such as the viewer and creator being in the same country.
Meta has built retention charts directly into Reels insights for the same reason. Instagram's own explanation of Reel watch-time analytics says creators can use the data to understand where people are engaged and where a stronger hook may be needed.
None of this means likes, comments, saves, shares, or conversions are worthless. They are not.
It means that if your goal is top-of-the-funnel awareness and you want to make videos that more people actually watch, retention deserves serious attention.
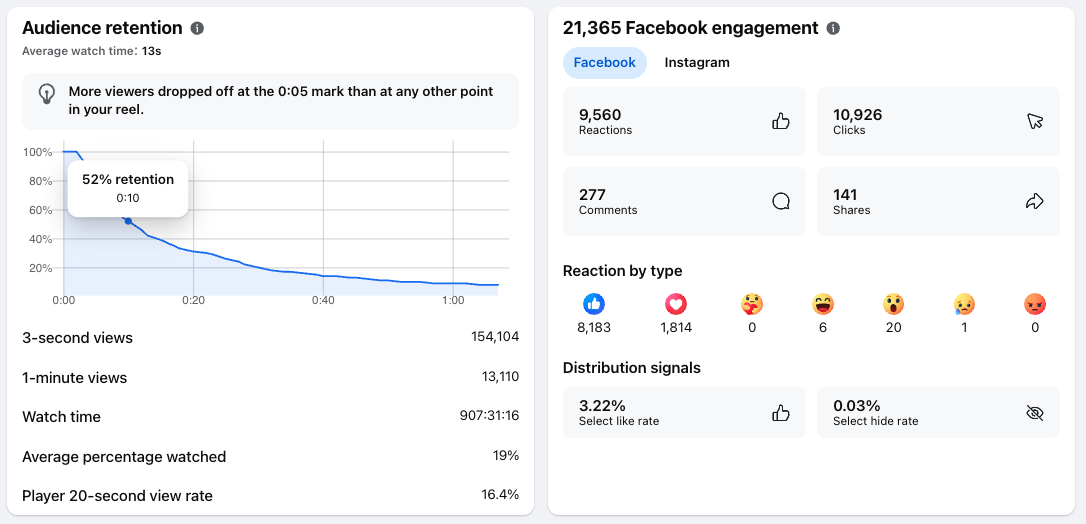
One of our clients had this audience retention on Facebook from the very first video we coached them on:
Views, Engagement, Retention, and Conversions Tell You Different Things
- Views: Did people start the video?
- Retention: Did you keep their attention?
- Likes and comments: Did they react to it?
- Shares: Was it valuable or interesting enough to send to someone else?
- Conversions: Did the attention lead to a business result?
If I am reviewing an awareness video and trying to figure out whether the actual content worked, I want to see the retention graph.
It is hard to hide from.
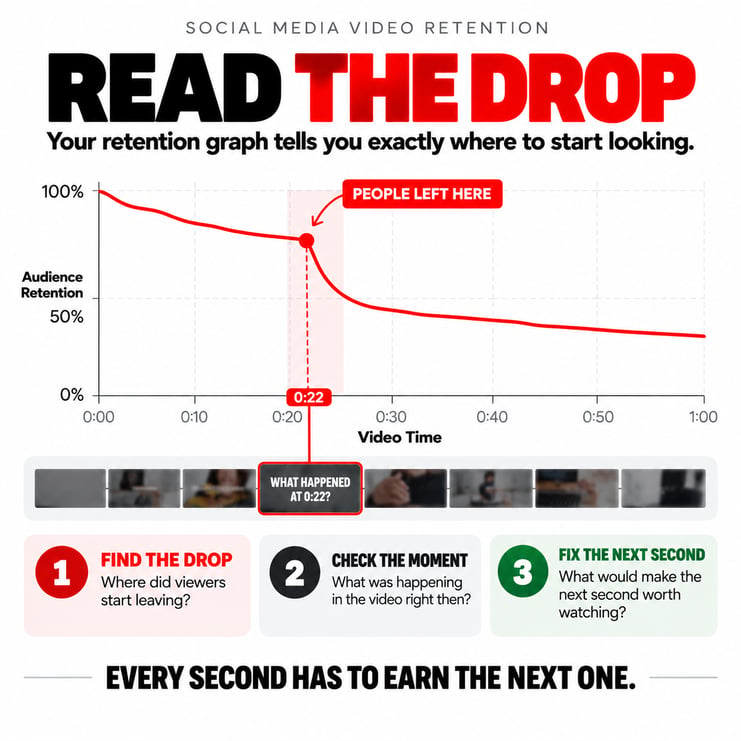
How to Read a Social Media Video Retention Graph
You do not need to be a data analyst to understand a retention graph.
Start with three questions:
- Where did people leave?
- What was happening in the video at that exact moment?
- What could I change so the next second feels worth watching?
That last question is the big one.
We have infinite entertainment sitting in our hands. Your video is competing against friends, celebrities, sports highlights, news, memes, creators, family photos, breaking stories, and millions of other videos.
Why should someone give you another second?
Your retention graph helps answer whether they did.
And the shape of that graph can tell you a lot about what went wrong.
Retention Graph #1: The Cliff Means Your Hook Is Not Working
This is probably the easiest retention problem to diagnose.
Your video starts.
And people leave.
Fast.
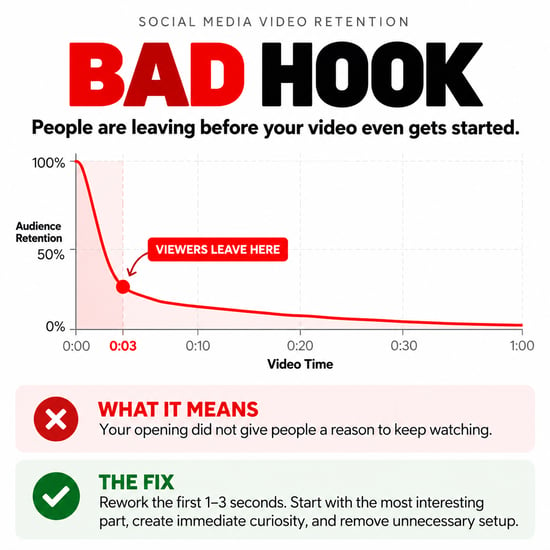
If your retention graph falls off a cliff in the first few seconds, your hook is usually the first thing to investigate.
A video hook is the opening moment that gives someone a reason to stop scrolling and keep watching. It might be what you say, what appears on screen, what viewers read in the text overlay, or all three at once.
On short-form social media, those first seconds matter because the viewer can leave with one movement of their thumb.
YouTube's creator guidance makes the same point. It says the initial seconds are when viewers decide whether to stay or move on, especially with Shorts and long-form video. YouTube recommends getting straight to the value and making sure the introduction delivers on the expectation that got someone to watch in the first place.
How Do You Fix a Bad Video Hook?
Start the video faster.
Do not introduce yourself. Do not explain what you are about to explain. Do not spend five seconds setting up something that could have been said in one.
Give me a reason to care.
At Torro, we often think about this as the Three-Hook Rule. Your opening can combine multiple reasons to stop:
- A strong verbal hook
- A visual hook
- On-screen text that creates context or curiosity
Those elements should work together.
If 100 people start your video and only 20 or 30 are left a few seconds later, do not spend all your time worrying about minute editing details later in the video.
Fix the opening first.
Retention Graph #2: A Late Drop Means Your Ending Is Losing People
This graph is different.
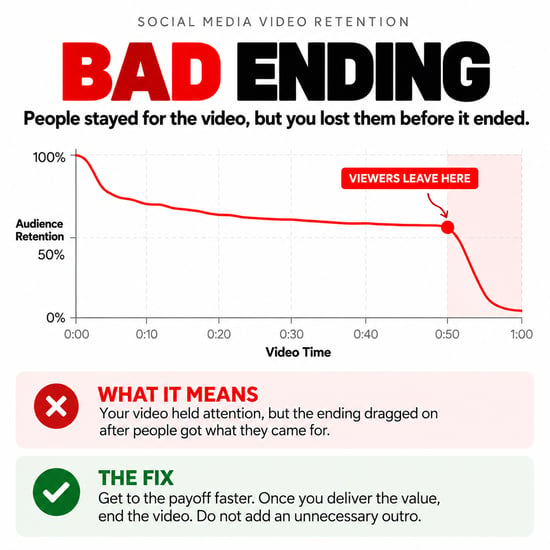
People watched the hook. They stayed through the actual content. Then something happened near the end and they bailed.
Your ending may simply be too long.
This happens all the time.
You already delivered the point, but the video keeps going.
You summarize what everyone just heard. You add a long call to action. You say, "So yeah, that's pretty much it." Or you slowly wrap up because that is how normal conversations work.
Social video is not a normal conversation.
If you delivered the payoff, you can end the video.
How Do You Fix a Bad Video Ending?
Look at the exact moment the drop begins.
Then ask yourself whether the viewer already got what they came for.
If the answer is yes, try ending the video there.
You do not always need a five-second outro. You do not need to ask viewers to like, comment, follow, subscribe, visit your website, call your mother, and tell three friends.
Sometimes the best ending is just the end.
Retention Graph #3: The Constant Slide Means the Whole Video Needs Work
This one hurts... I can't sugarcoat it: Your video sucks.
There is no obvious cliff. No single bad section. No clean moment where everything went wrong.
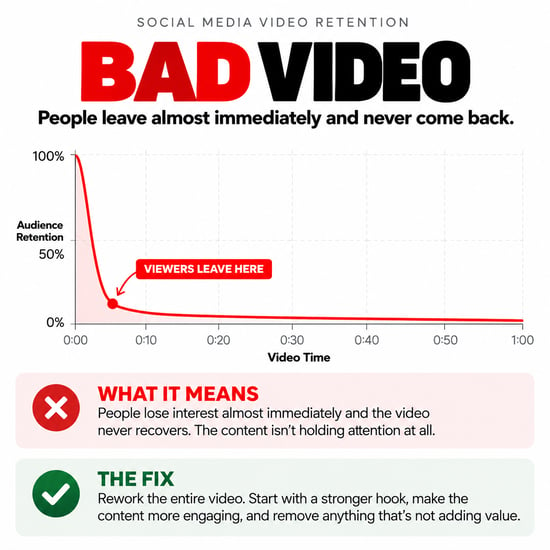
People just keep leaving.
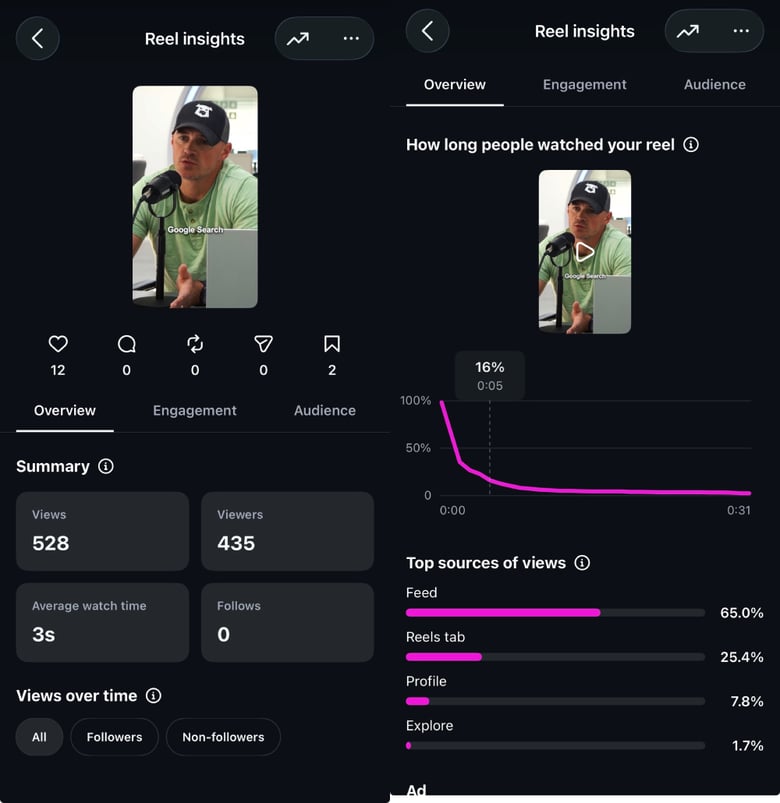
If the retention graph consistently slides downward throughout the entire video, the problem may be the video itself.
The idea may not be interesting enough. The pacing could be slow. The information could be too obvious. Maybe the video is three times longer than it needs to be.
Or maybe nothing is creating enough curiosity to make someone want the next sentence.
How Do You Fix a Video With Poor Retention Throughout?
Do not automatically assume another jump cut will save it.
Go back to the idea.
- Is the topic actually interesting to the audience?
- Can the video be much shorter?
- Are you repeating yourself?
- Is there a clear payoff?
- Does each section create a reason to watch the next one?
- Would you watch this if you did not know the person speaking?
That last question can be uncomfortable.
Ask it anyway.
Sometimes the edit is not the problem. The content is.
Here's a real example of one of our worst videos lately:
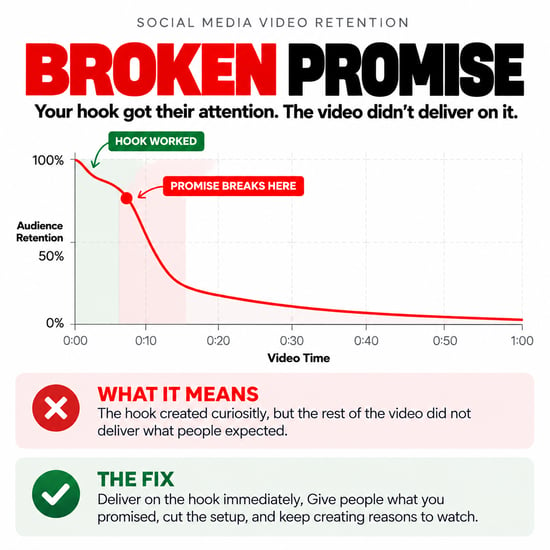
Retention Graph #4: A Good Hook Followed by a Big Drop Means You Did Not Deliver
This graph is especially useful because it proves something important:
A great hook cannot save a video that does not deliver.
You got their attention. Great.
Now you have to keep it.
If your hook makes a huge promise and the next 15 seconds are setup, background information, or rambling, viewers figure it out quickly.
This is where clickbait can backfire.
"Nobody is talking about this Instagram trick..."
Okay. What's the trick?
If I have to sit through your life story before you tell me, I'm gone.
The Simple Formula: Hook, Promise, Deliver, Entertain
There is no perfect formula for every social media video, but this is a useful way to think about awareness content:
HOOK → PROMISE → DELIVER → ENTERTAIN
The hook earns the next few seconds.
The promise creates a reason to continue.
The delivery gives the viewer what they came for.
And the entertainment keeps the information from feeling like work.
You do not need to be a comedian. Entertainment can mean good pacing, storytelling, demonstrations, visual changes, examples, personality, suspense, or simply getting to the point.
But you cannot make a promise in the hook and then forget about it.
The retention graph will show you.
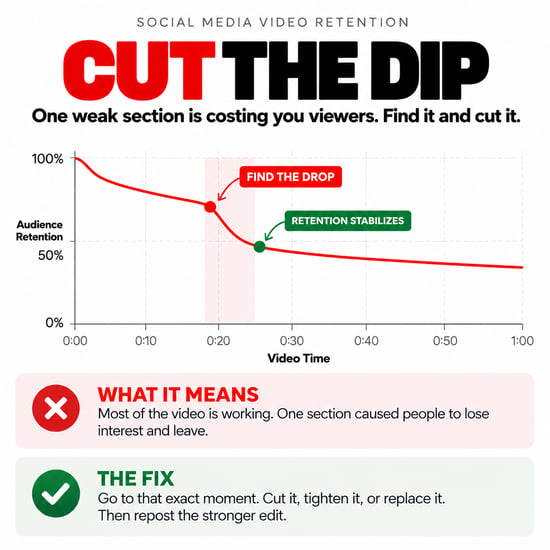
Retention Graph #5: Find the Dip, Cut It, and Try Again
This might be my favorite retention graph because it gives you something very specific to fix.
The video is working.
Then there is a dip.
Then the remaining audience keeps watching.
Go to that timestamp.
What happened?
Did you start explaining something nobody needed explained? Did you repeat the point? Was there a long pause? Did the visual stop changing? Did you go off topic?
Whatever happened, that section deserves a closer look.
Should You Edit and Repost a Social Media Video?
Yes, you can edit and repost a social media video when the retention data gives you a clear reason to improve it.
There is no shame in giving a good idea another chance.
Cut the weak section. Tighten the opening. Move the payoff earlier. Change the text on screen. Try another edit.
YouTube explicitly recommends using retention data to identify where viewers start and stop watching and using those insights to improve content. It also notes that top moments later in a video may be worth moving earlier because audience size typically decreases as a video continues.
Your first edit is not sacred.
The audience just gave you feedback. Use it.
What Is a Good Video Retention Rate?
A good video retention rate depends on the length of the video, platform, topic, audience, traffic source, and where you are measuring retention. There is no universal percentage that makes a social media video good or viral.
This matters.
A 15-second Reel and a three-minute video should not be judged by the same completion percentage.
YouTube confirms this directly. Its recommendation guidance says there is no universal ideal video length and that creators should make videos only as long as needed to deliver the value. YouTube also says relative watch time matters more for shorter videos while absolute watch time becomes more important for longer videos.
So do not treat any benchmark as a law.
That said, creator Yasin Mammeri of Viral Video Club uses a useful rule of thumb for short-form content: if roughly 50% to 60% of viewers are still watching after the opening few seconds, the hook is doing a solid job. If you can keep roughly 30% of the original audience watching deep into the video, that can be a sign of very strong retention.
Use those numbers as reference points, not guarantees.
The better comparison is often against yourself.
Take ten similar videos. Compare their length, topic, first-three-second retention, average watch time, average percentage watched, and overall reach.
Then look for patterns.
Your own data will eventually become more useful than a generic benchmark from someone else's account.
What Do Retention Metrics Look Like on Instagram and Facebook?
Instagram and Facebook both provide video insights that can help you understand how long people watched.
Meta introduced interactive retention charts for Reels so creators can see how many people are watching on a moment-by-moment basis. Instagram also reports metrics such as total watch time and average watch time.
Meta defines total watch time as the total amount of time a Reel was played, including replay time. Average watch time is the average amount of time spent playing the Reel based on its plays.
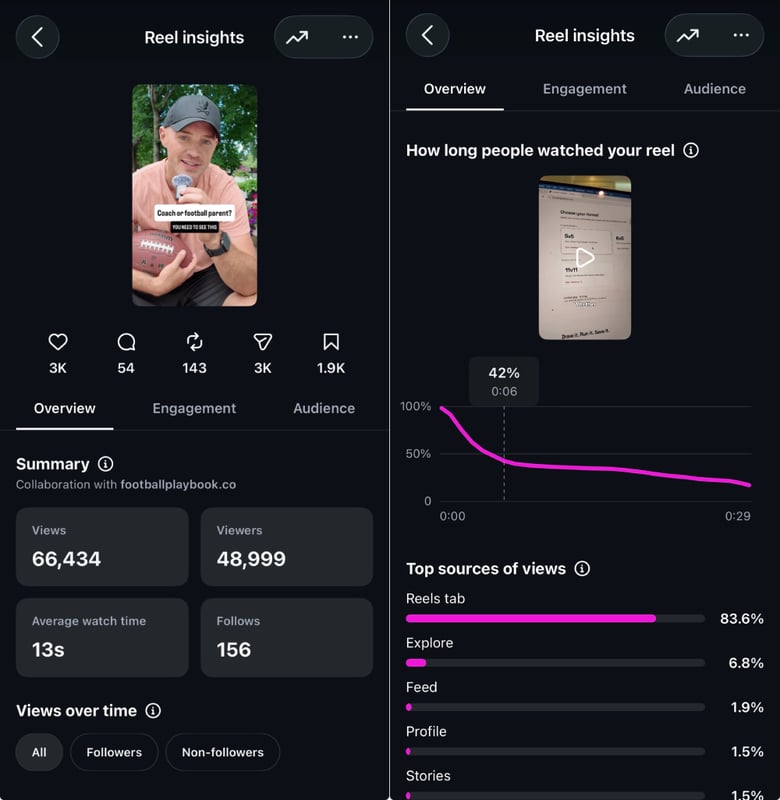
In Instagram Reel Insights, the retention graph makes the problem visual.
For example, if the graph shows only 28% retention at 0:03, that means roughly 72% of the starting audience is already gone by the three-second mark.
That should immediately send you back to the opening.
What did viewers see?
What did you say?
Was there enough context?
Was the first sentence about them or about you?
Did you give them any reason to stay?
Facebook can show similar information, including average watch time, average percentage watched, and points where viewers dropped off.
One of our example videos averaged seven seconds of watch time and only 12% watched on average. Facebook specifically identified the six-second mark as the video's largest point of audience drop-off.
That is much more useful than simply knowing the video received thousands of three-second views.
Now we know where to look.
How to Improve Social Media Video Retention Step by Step
If your videos are not holding attention, do not randomly change everything. Use the retention data to diagnose the problem.
- Check the first three seconds.
If there is a huge initial drop, start with the hook. Test a different opening before worrying about the rest of the video. - Find the steepest drop.
Look at the exact timestamp where viewers leave fastest.